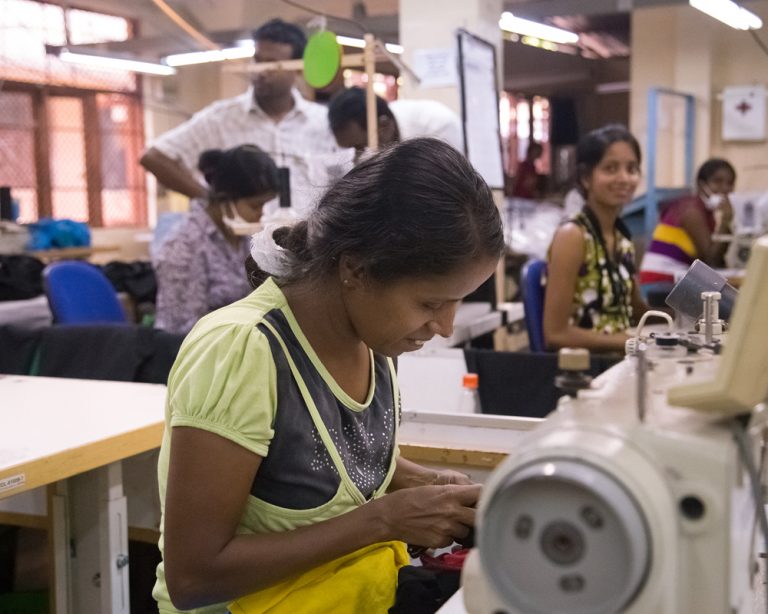
APPAREL OPERATIONS
Technopak is one of the first management consultants in India to offer complete advisory services for apparel operations. Additionally, the company’s area of expertise includes garment manufacturing, processes in textile, business planning and strategy, factory start-up, performance improvement and skill development. Furthermore, the firm has been assisting Indian and international textile & apparel manufacturers, brands and development agencies in apparel operations.
Textile and Apparel Industry is one of the oldest industries of the human civilization. The industry has evolved continuously, from apparels that were hand sewn at home to apparels sewn in bulk in factories; from draped garments to snug garments and from four seasons a year to twenty-four seasons a year. Clothing and textiles reflect the social customs and culture in a society. Over a period of time, there has been multiple shifts in preferred location for apparel manufacturing, from one country to other and sometimes to a different continent altogether. Factors on which these preferences depend have been:
- Manufacturing cost
- Market proximity (Retailer/ End customer)
Apparel manufacturing has been a labor driven industry ever since, and relocates wherever the prices both on labor and the duty structures are more economical for the global brands and retailers. Due to this, in the past few decades, apparel manufacturing industry’s geographical distribution has changed completely, and has resulted in loss of employment in Europe
and North America, and creating job opportunities in Asia and other developing parts of the world. Fast fashion, use of technological advancement and changing business landscape are some of the variables resulting in changes in the textile and apparel industry. Cost effectiveness and streamlined process that caters textile manufacturing are the result of advancement in technology.
These APPAREL OPERATIONS complexities make the industry prone to higher process variance and changeable manufacturing environment; this is the reason behind more focused approach towards performance evaluation and monitoring. Various approaches and indicators are being used by apparel manufacturers to improve their business conduct. In some cases, these are also a combination of different performance indicators. This outlook is an approach towards identifying the key performance indicators and explaining each of them briefly for application in apparel manufacturing for monitoring, analysis, benchmark, and goal setting to improve manufacturing performance
Key Performance indicators in apparel operations are a set of measures that a company uses to gauge its progress towards achieving its key business objectives and set targets To assess their success at reaching targets organizations use KPIs at two levels:
- First level KPIs emphasise organization’s overall performance 2. Second level KPIs emphasise department processes such as Cutting, Sewing, Finishing, Quality, etc.
Measurement of performance involves:
- Defining what to measure
- Identifying methods of data collection
- Data collection
- Data analysis
Benefits of measuring performance in apparel operations are:
- To learn and improve • To control and monitor people as well as processes • To compare organization’s performance against Industry benchmarks • To report externally and demonstrate compliance
KPI’s are associated with organization’s goals and objectives. Monitoring, improvement and evaluation is needed by every organization, whether it is on a smaller scale or a larger one. Once the organization has figured out its mission, stake holders set the goals. This is because, they need an approach to evaluate progress towards the goal, and this is where the role of KPIs becomes essential. They are used to measure true performance against key success factors. Selecting the correct KPIs depends on understanding of organization’s priorities. It depends on which industry the organization belongs to, e.g. KPIs that are useful for an Apparel Manufacturer may differ from the KPIs useful for an Investment Banker
Quality is defined as complying with the requirements of buyer. Goods are accepted only if the quality parameters meet the required quality parameters set by them. If non-conformance is found, manufacturers have to rework on goods at their own cost. Cost of repair is not endured by the buyer; it is endured by the manufacturer and is the unwanted or extra cost to be borne by the manufacturer. By controlling quality in the process of manufacturing, this unwanted cost can be reduced, and this will in turn reduce rejections and delayed delivery rates. Quality performance can be measured as % Defective Rate, Defects per Hundred Units (DHU), Rejection Rate, and Inspection Pass Rate etc.
1.1 Defects per Hundred Units – DHU
Defects are all the non-conformances that are not acceptable by the end customer. The non-conformances may be improper shape of garment, broken button or other trims, holes in fabric, skip stitch, broken seam etc. The defects causing non-conformances are abrasion marks, double pick, oil stain, hole, bow, skew, crease, dye stain, slubs, calendar line, contamination etc.
Any garment containing one or more than one defects can be considered as a defective garment. Defect per Hundred Units (DHU) can be calculated as number of defects per hundred garments checked. DHU calculation is a universal measure of quality which provides a platform to do an in-depth analysis to identify any deviant process for improvements. 1.2 Buyer Inspection Pass Rate Buyer inspection pass rate is defined as the ratio of number of batches passing at the first inspection to the total number of batches inspected. This rate reflects the process capability aspect of any manufacturing facility.
The improvements can be achieved through eliminating non-value activities such as defects and rework in a manufacturing environment without changing the pace of work (efficiency) or resource deployment design (MMR). 1.3 Cut to ship ratio The ratio of the total number of garments shipped vs the total number of garments cut is known as cut to ship ratio. It indicates wastage in manufacturing process and is calculated style wise for the styles shipped in a particular month and the average of all styles is cut to ship ratio for the month.
KEY SERVICE AREAS

STRATEGY
& PLANNING
- Business entry and growth strategy
- Business plan, resource requirement and key business numbers
- Manufacturing and supplying capabilities

PERFORMANCE
ENHANCEMENT
- Productivity/efficiency enhancement
- Material utilization and quality enhancement
- Streamlining merchandising and pre-production activities
- Lean manufacturing tools
- Visual control and SOPs\
- Total quality management

START-UP
ASSISTANCE
- Planning and design of factory
- Implementation of layouts and processes
- Selection and training of middle management
- Efficiency and production build-up

SETTING UP OPERATOR
TRAINING CENTRE
- Program design and team profile development
- Setting up selection and recruitment criteria and procedures for operators
- Training operators on AAMT methodology

CAPACITY
BUILDING
- Training need assessment
- Middle management training on master plato
- Training for merchandisers, quality personnel and industrial engineers
- Establish training methodology

PRE-PRODUCTION
PROCESS STREAMING
- Capacity analysis
- Operator remunerations
- Setting time and method standards
- Layout and method improvements
- Production planning

INCENTIVE
SCHEMES
- Monitoring of individual operator performance and efficiency
- Designing performance-based incentive schemes for operators
- Development of KPI-based appraisal for middle management

SOURCING
SERVICES
- Industry landscape and product strategy
- Selection of key positions
- Identification, due diligence, training, and analysis of vendors

